 Rocket Software Celebrates Pride Month
 Identify, visualize, and analyze CICS transactions and drill down to see application events in detail
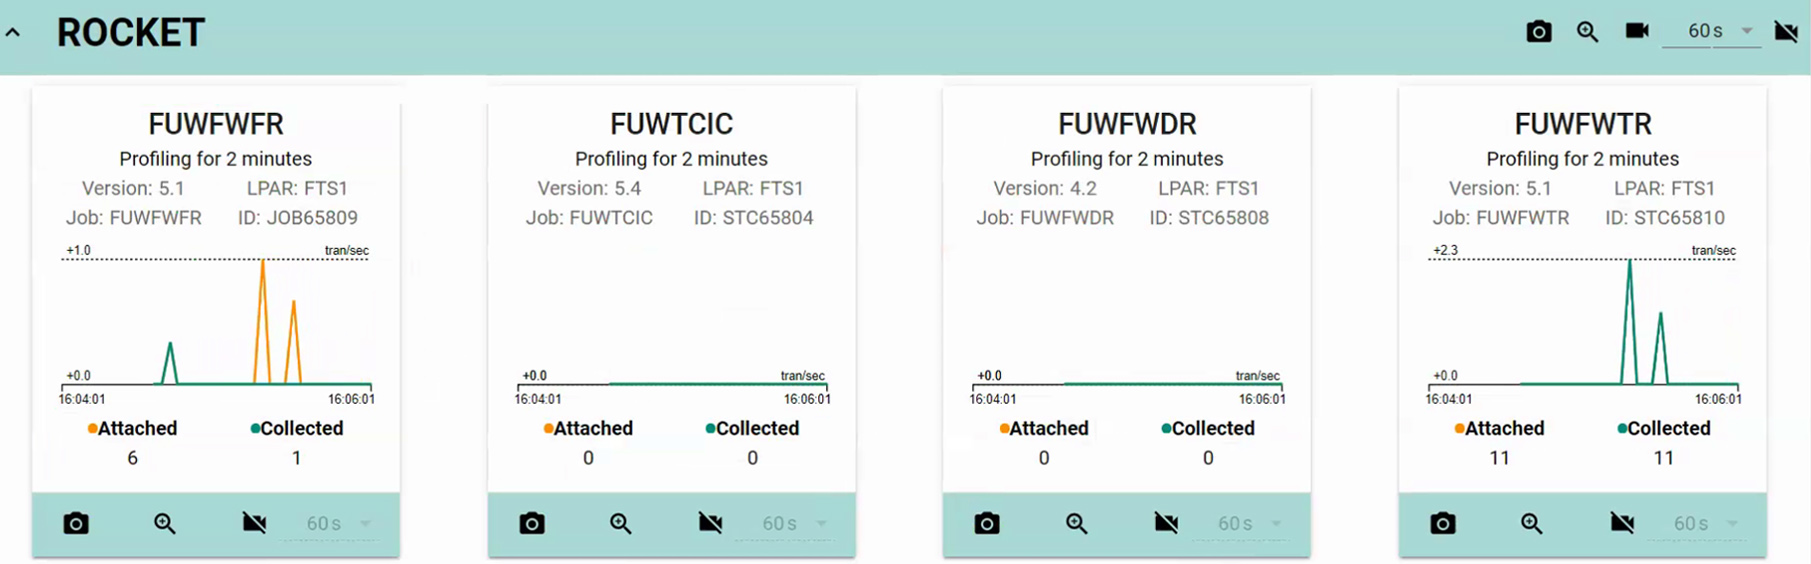
Analyze Individual CICS Transactions
See individual transactions execute across multiple CICS regions, so you can spend less time sorting through diagnostic data and more time solving problems.
Capture, Analyze Problems While Occurring
Capture and analyze problems when they first occur with point-in-time snapshots of CICS internal trace data, reducing the need to reproduce issues.
IBM® CICS® Transaction Server for z/OS is a critical part of your mainframe environment. Ensuring applications run well and you can quickly find and fix errors are daily requirements.
C\Prof provides the details you need to diagnose, visualize, and analyze problems in your CICS applications faster, so you can spend less time sorting through diagnostic data and more time solving problems.
Having minimal impact on your business-critical applications, C\Prof runs outside of the CICS address space and requires no changes to CICS itself. You can collect and interpret the trace data with significantly less impact on your business operations. With a concise format that’s easy to use, Rocket C\Prof helps application engineers navigate their trace data without relying on system administrators. System administrators are now more available for other business needs, and the efficiency of the whole system IT team increases.
Whether collecting data continuously or in short bursts, C\Prof insights allow you to:
- Select transactions based on criteria
- Sift through millions of transactions with powerful find, filter, save, and sort
- Identify programs used by a transaction, and the performance profile of each
- Follow the program flow across multiple CICS regions
- Review application calls made by each program in rich detail with elapsed time analysis
- Dive deep into trace events associated with each transaction or application call to identify the cause of a delay or problem